Posts Tagged ‘Data’
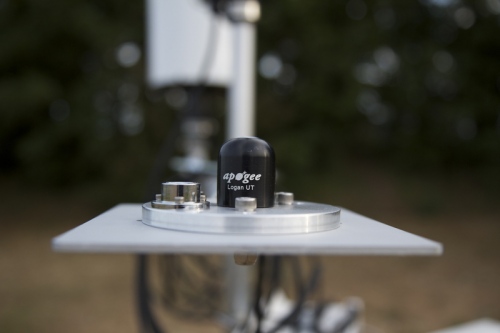
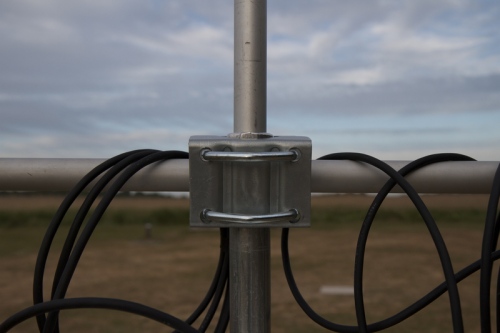
BWS-200 weather station details
Weatherspark
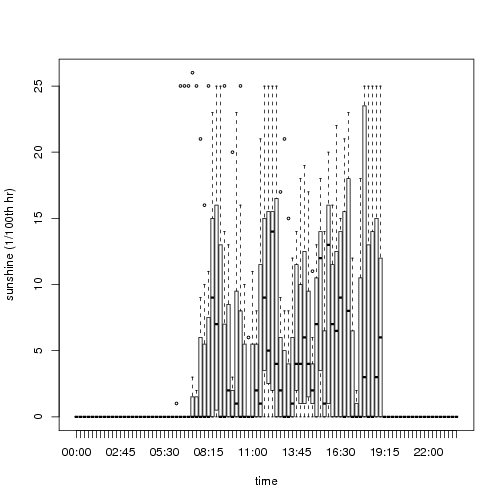
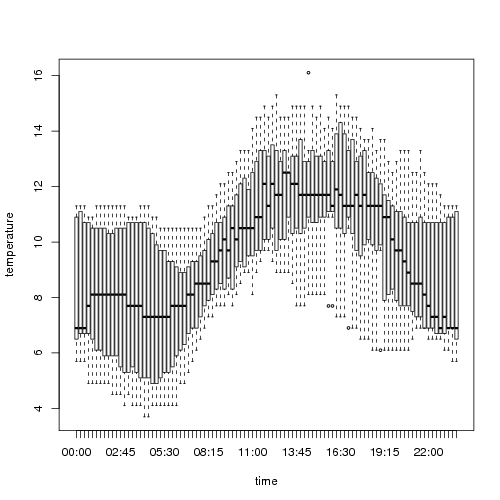
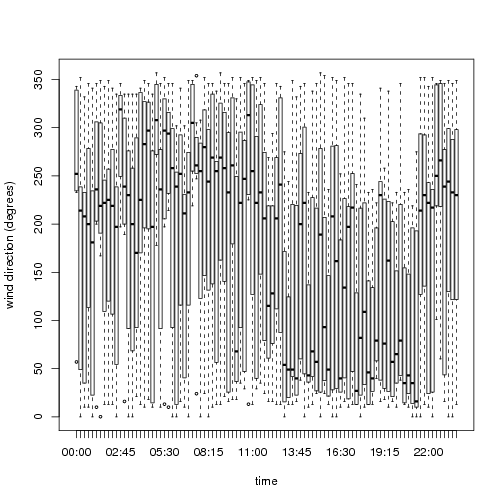
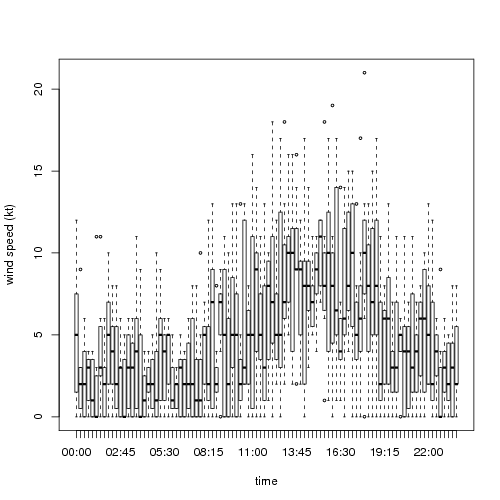
In preparation for next month’s Faster Than Sound, we’ve been doing some analysis of the local area’s weather data from past years, to gain some insight into what the conditions are likely to be on the day. The gratifying part of this is producing graphical visualisations of weather patterns, which can often be aesthetically beautiful as well as useful for understanding underlying structure.
Here are a couple from last year’s research at Dungeness, representing the distribution of wind direction over a month:
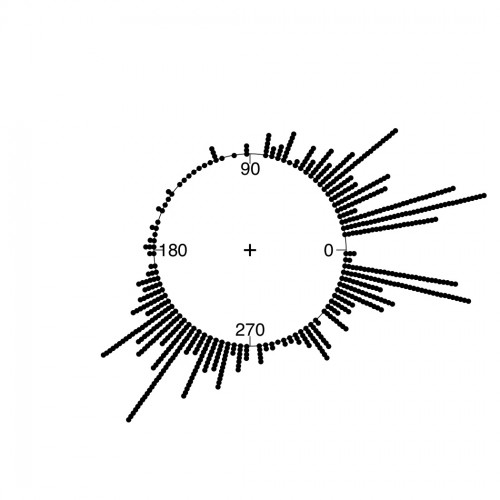
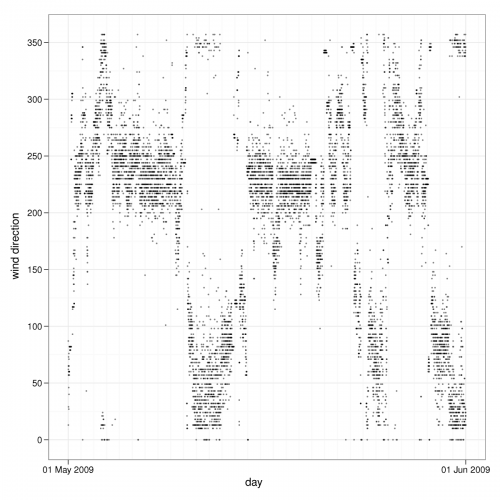
In looking into online approaches, we came across Weatherspark, which is an incredibly full-featured tool to look into current and historical meteorological trends around the world. It includes data from a weather station not too far from Aldeburgh, and can be filtered by numerous attributes: wind speed and direction, sun hours, temperature, dew point, humidity, precipitation, and more.
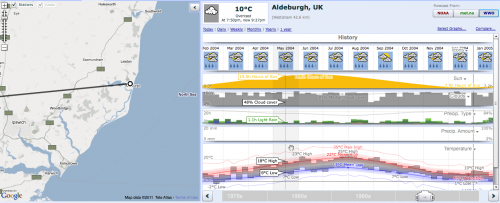
It allows data from different stations to also be compared, and – in a really nice feature – generates written weather forecasts for any given day. Check it out for May 28th.
Weather data #3: Wind direction through May 2009
Thanks once again to the impressive archival of Romney Marsh Weather, here’s a third plot of wind direction data: this time, on a 5-minutely basis, through the entirety of May 2009.
All of these plots have been created with the invaluable R toolkit, with ggplot2 and circstats for polar plots.
Weather data #2: Wind direction
As a followup to our earlier post on weather data from Romney Marsh, here’s a quick circle plot of the wind direction over the same time period (30 April – 6 May 2010).
It seems to tally pretty closely with the Met Office commentary on southern wind patterns: prevailing south-westerlies from the passing Atlantic depressions, alongside seasonal winds from the north-east due to high pressure over Scandinavia.

Romney Marsh Wind Direction, w/e 6 May 2010.
Data: Romney Marsh Weather


